ART WORKS FOR TEACHERS PODCAST | EPISODE 145 | 39:25 MIN
Can Testing + Creativity Coexist?
Is it possible to honor both creativity and accountability in today's test-driven schools? In this episode, Harvard psychometrician Dr. Andrew Ho joins Susan to unpack what test scores really mean and how educators can use data without sacrificing authentic learning.
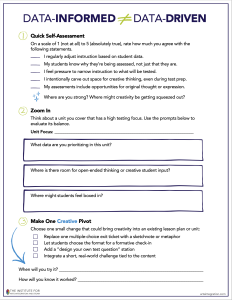
Enjoy this free download of the Data-Informed Reflection Tool.
All right, welcome Andrew. Thank you so much for joining me today.
Andrew
Thank you for having me.
Susan
Of course. So I always start our show by asking our guests, like, how did you get to where you are? What does that journey look like for you?
Andrew
Yeah, so my job title is psychometrician and it's a scary sounding job title. It sounds, as I say, more like an insult than a job. But psychometrician means that I do work in psychological, so that's where the psycho comes from, and psychological measurement. So that's where the metrics come from, so psychometric. So whenever you hear a job title that's unfamiliar, it's a very good question to ask, you how does one get into that? It's not like, finance or medicine or law where there's sort of an established track. So I say that, you know, I do work in educational testing and I think maybe you two and maybe your listeners too often have a journey with educational testing. I think any educator does. They sort of start with this sort of compliance, like I'm a student, I'm a teacher, I assess, that's what I do. And then that's the first stage. And then they go to sort of like frustration and anger.
And like, why am I testing? And why are people making me test? And why do I have to take tests if I'm a student? And then it moves on to a kind of acceptance. Or as in my work, I try to make tests better. So how did I get from those, from the first stage from compliance, then to anger, then to acceptance, right? So I started as a teacher. I'm a third generation teacher. My mom was a teacher. My grandmother was a teacher.
And I had teaching experiences from the time I was in high school through summers in college. And I taught creative writing in the summertime. And I also taught physics and then eventually AP physics. I was a teacher for a long time and a student at the same time. And I took tests and I administered tests and that was my era of compliance. And then I studied abroad in my junior year in Japan, in Kyoto, Japan. And I noticed there how fatalistic students and teachers felt about testing. They felt like they were just doing it for the test. The teachers were teaching it to the test and the students were learning only for the test. It's like when educators say, this isn't gonna be on the test and everyone just shuts down, right? And that's like that every day. And that was what I felt in the classrooms that I visited. And that was my of anchor stage. It's like, wait a second, this is what testing does to students and to teachers, it makes them these sort of pawns. They lack agency, they lack a sense of competence, it creates inequality, it inhibits creativity. And so that was definitely my anger stage and that led me to wonder if I could do anything about it. And I looked around and found out that there is in fact this field of educational testing and measurements with job titles like psychometrician where you work to make numbers meaningful, right? You try to figure out how people can use numbers, including test scores, better. And part of using test scores better, as I say often, is using them less, right? Let's use test scores less than we do. And so that was now my era of acceptance, right? So, okay, I understand how test scores function in society and I work to improve them however I can. I wonder, Susan, for you and your listeners, if you've also had that three-stage sort of transition from compliant educator or students to anger and frustration to, I'm not sure if you're in a stage of acceptance yet, many more people are still on the stage of anger.
Susan
Yeah, certainly as an educator myself, that's definitely been my experience. And especially as a music educator, that has a whole different context for me. One, as a proctor, which I was often sat in the room with the kids to make sure that they were doing what they were supposed to do on the test, which was a whole other light bulb moment for me watching students and how they engaged with the test. But also, as I progressed, the more common it became to test with numbers a creative field like music and how do we put scores on things that students are creating from their core. That's always been an interesting mix for me and I know for a lot of educators that are listening and also that I work with that is still something that they still struggle with. I have to tell you I loved watching your YouTube video on
It was like, it's an eight minute video. We'll link to it in the show notes about essentially what you do, how it works, what the data shows. And in the captions, when it auto captions psychometrician, it makes it psycho magician as if you have like this magic power. And I was like, you know, as I was listening to you, was thinking, you know, actually, when you look at data, the way that you present data, which I want to get into.
The way that you leverage visuals and you use data visualization to help tell a story behind the numbers and help us to understand that more. It is kind of like magic. So I would love to dive in that. Yeah, right. Yeah, exactly. So talk to me a little bit about how you do use data visualization and visual tools to help tell the story behind the data and why that's important.
Andrew
That's very kind of you to say. I hope not so psychotic.
Yeah, so I say often, and it's definitely something that for you as a music educator and your listeners, matter what they teach, I try to remind people that numbers have to be qualitative before they're quantitative, right? So I say in my field of measurement, if you're going to measure something, don't start with the numbers. Please don't start with the numbers. It has to start qualitatively. You have to understand what it is in fact you're measuring. And I faced this with my own children. have two daughters who are 11 and 13. And I sometimes ask them, how was your day? that sometimes when they take tests, I say what all parents default to, which is how did you do? How did you do on that music test? And it's so quantitatively coded, right? It's so just like, tell me, were you at the 90th percentile or the 10th percentile? Did you get a 700 or 300 on your SATs. You get a 30 or a 10 on your AC. So it's so quantitative and we so rarely ask, like, what's the story? What is it in fact that we're quantifying? And in music, I mean, you know, I was a musician too and I played the clarinet for a long time and it just sort of breaks your heart to try to think of, you know, quantifying something as qualitatively rich as music. And so in my own teaching and in my own research, I try to follow that mantra that you have to start qualitative before you go to the quantitative, right? And then I also try to remind people that once you give people a number, you have to re-install it, remind people what the qualitative story was. And so I try to, in my graphs and in my quantities, it's like, what does that mean? What is it and more than what does it mean? It's like what does it feel like? Right? And that I think is the challenge of any communicator with numbers, including, you know, the math teachers and the science teachers and, you know, any other subject that ever uses numbers, you have to be able to put it in a sentence and tell a story about it before people can understand what you're talking about. So I'm glad you noticed that I did my best, but it's something I and we all can get better at is telling not just reporting numbers, but telling a story with numbers.
Susan
Yeah, I think it's super powerful to consider the qualitative before considering the quantitative especially When it's in a field where many feel like the number is the number it's black and white and I have often said You can make the data mean anything you want that it's depending upon the three that you give it So what are some ways how let's go back. Let's step back for educators. What are some practical ways that they can make the data qualitative first or look for the qualitative way to support the numbers and then back into the quantitative supporting behind it.
Andrew
Yeah, so my colleagues do a lot of work in what we call learning progressions. learning progressions start with quality. They start with words. They start with ideas. What is it that you know and can do when you are a novice? What is it that you know and can do when you are an expert? And I think it's really important for any educator to identify that learning progression and help students identify for themselves where they are along that progression. There's, and I know you've, I'm sure you've seen this in your guests and in your own work, but there's a very simple, maybe simplistic, but simple theory called self-determination theory, which sort of says that all students and all learners and all people need three things to be motivated. They need a sense of agency and control, right? One, they need a sense of competence that they're actually sort of good at something.
And then they need a sense of social integration, right? Or a sense of like having other people who are doing something with you. And I think that that's true in learning how to use numbers, in teaching and learning and all things. So you have to be able to show students, know, like where they are and that gives them a sense of where they stand and then feel like they have the ability to grow, right? That they are competent and we can describe them no matter where they are in the learning continuum, you have a place here and you can move up this continuum and you have friends who are moving up this continuum with you. Some are a little bit ahead, some are a little bit behind, but we're all in this together. And that's just a very sort of simple, you know, and for your educators, very familiar framework for good education. That you don't do it alone, that you do it in this socially integrated community space, but that everybody sort of knows where they are.
And that is not shameful, right? That that is just, know, if I have a low score, I am just at this stage temporarily and I and my fellow students and my teachers are all working together to move you up this learning progression, which by the way, is entirely, can be entirely qualitative, right? There never has to be a score anywhere in this educative process, right? Now, when I say in my strength in numbers talk that you mentioned, is that numbers can sometimes help that process by revealing where a student is and where they can go next. But far more often, I'd say nine times out of 10, it is disempowering to give students a number. It's disempowering to give them a score. Even when they're a nine out of 10 or a 10 out of 10, they can feel good for the student but it can ultimately feel like, I don't have to work anymore or I'm naturally good at this and will always be good at this. And later in life, when they stumble, that sort of sense of that lack of competence to go back to that theory will end up discouraging them. So the key, I think the challenge that I face and educators face everywhere is how to not ignore numbers, right, entirely but to give students and teachers numbers in that framework, right? Where they know that if whatever stage they're at, they're there temporarily, right? That they have agency and competence and a community that moves them up that learning progression. And if numbers can help, great, but far more often they harm. And I would like to think that we can use numbers to help
But I would say unless you're good at it, unless you have a framework for it, go light with numbers, use them far less often than we currently do. And there's nothing inherently bad about numbers, but I say, you know, we have these fallacies around numbers, but we think they're more meaningful, more precise, and more permanent than they are, right? More meaningful, more precise, and more permanent. And that is a fallacy deep in all of our own heads.
I'd say my first recommendation is, don't use them. And my second recommendation is, well, actually, if you can use them, you dispel those myths, you show them that numbers, show their learning over time, and can give you that sense of agency, competence, and even social integration, if we can all move to increase our scores. Now, again, my first recommendation probably holds, though.
When in doubt, don't quantify.
Susan
So I'm assuming that's what you mean by test less, right?
Andrew
In general, our society, as again, and we are weak to numbers. So the baseline recommendation is use scores less. I don't mind assessing in a broad sense, but the quantification of complex and beautiful learning moments too often simplifies, reifies, reduces and hurts kids and teachers. Now, it's not inevitable and we can use numbers to empower ourselves, but on balance, we have a lot of work to do to get better at that.
Susan
Yeah, so as you're speaking, I'm thinking about this kind of seesaw that we find ourselves on, especially now when education is filled with evidence. Like, let's prove that it works, especially with the whole controversy around the science of reading that's going on right now. And it's overflowing into a lot of other areas in education of you can't just go on your gut feeling on whether or not this is working for your students, need to have evidence that proves this is working. And at the same time, not test our kids to death, or give undue meaning to numbers that don't really exist. So how does an educator balance those things? What would you recommend?
Andrew
So that's a good question. would say like it's not our, it's not educators responsibility to test less. It's our leaders response. It's educators, it's our citizens, it's us as citizens advocating for a rebalancing of like in class time to the process of teaching and learning and less so the process of testing. And there's actually broad consensus about this, but because I think we, because our rhetoric is so oriented towards end of year tests and results that just as I noticed my time in Japan so many years ago, that sort of back propagates onto teachers and to administrators and then to students and parents too, that just because we have this end of year test that is meant to advance research, to monitor educational progress, even if that's not that much time, like we are so weak to numbers that we think it matters more than it does. We think it matters more than it does. And so we say, you know what, like all of a sudden, now I'm feeling the pressure. Now I've got to torque my curriculum and activities to give you more tests like opportunities. And that is actually not what is intended. That's not what researchers recommend. It's not even what policymakers want. They just want to sound tough. they say, oh, you got to hit those results. But actually, if you over-focus on the results, this is well known in sociology, if you over-focus on those results, they actually end up being fake. They actually end up, again, just inflating those test scores and making them meaningless. So no one really wants this over-focus on numbers. Everyone really wants to spend more time in the classroom. How do we get to this point where it's like, actually, don't worry about that test so much. It's just one of these many other indicators that we have for measuring educational progress. And I think that's a real challenge. You see in some of the best classrooms that this is actually the most important form of what we call assessment literacy for teachers. It's actually
But tests doesn't matter that much. Even in districts and some states that use these kinds of value-added models that actually try to report what teachers add to tests, it's not that much of what matters in their evaluation even. But they gravitate. We, as people, tend to overemphasize and overinterpret numbers. Even in applying to places like Harvard, where I'm a professor,
You ask students, hey, what do you think matters most on an application to Harvard? People say, well, test scores, I'm sure, GPA, I'm sure. It's like they all go to these quantities. And what they don't realize is that, well, at least before a chat GPT, it's a statement of purpose. It's the essay. It's the context that you bring to it. It's the qualitative before the quantitative. So maybe you and your listeners and we can think about how to diffuse or diminish the role of test scores and quantities in our heads and in our society, because that's really the fundamental problem. We don't even want you to, I say we as like researchers and policymakers who are studying what works, we don't want you to notice the test. This is what's creating these movements called stealth assessments and test-less assessments. We don't want you to notice the test. We don't want it to be a big deal. We're trying to measure, but we're not trying to influence. We just want to get a little thermometer.
But the way that we work was like, ooh, if that matters, then you're telling me I got to torque my whole curriculum and my students' experience towards testing, and that's not what we want. So I'd love to hear some ideas besides me preaching about it.
Susan
Well, no, no, I was actually going to follow up because I know you worked with policymakers, you've worked with educational leaders for years. How do we make that case? What have you found to be successful or meaningful to the people who are making those decisions to advocate for not putting that emphasis on there?
Andrew
It's a good question. Again, I think there are two, it's probably naive to make this distinction, but there are sort of these two levels. One at this aggregate level where we want to monitor educational progress without influencing educational practice that much. And then there's sort of the level of day-to-day educational practice. And you'd like to think the two could be separate.
You'd like to think, we're just going to measure where kids are. We're trying to make sure schools are doing what they're doing at a high level and offer support if they aren't. And at the level of the classroom, you just hope that day-to-day activities are advancing through good decisions from teachers and administrators through curriculum and the like. And I think, for better and for worse, the American system of local control does buffer that somewhat, right? It does create that buffer. I think it's in that interstitial space where you have leaders feeling like principals, for example, feeling that pressure from superintendents and state chiefs, for example, and then talking tough and pushing that down on teachers. I think that's the level where it's like, maybe if they could create a little bit more of a buffer, because honestly, again,
No one wants these inflated test scores where you're torquing more and more of your time towards test-like activities unless those are in fact authentic, which they too rarely are.
Susan
Right, I'm curious, one of the things that I have noticed over the last probably 18 months, more so than ever before, is this idea around collaboration versus competition. And I wonder, as we are starting to understand the value more of collaboration, working together on various kinds of projects versus competing to be the best at something.
How do you feel like, do you feel like competition has led us into this kind of arena where the numbers mean more than they do? And do you think moving towards collaboration can help us with that? Or do you feel like that's a slippery slope?
Andrew
Yeah, I'm not sure I'd want to make close. So first of all, love there are few things as important as social skills broadly. And my colleague David Deming here at the Harvard Graduate School of Education and Harvard itself has done a lot of good work on that. If you look at any job posting, it's like in addition to all the other skills, there's also like, hey, you better be able to work well in teams.
You better be able to have a conversation with other people and to be able to motivate people and be able to identify your own growth areas and grow accordingly. But I don't want to also say that the opposite of collaboration is competition. As someone who likes to play games and
I don't think there's something inherently wrong about competition. It's that kind of competition where you only feel like you're making progress when other people go down or you knock other people down. So I think competition is great sometimes, but it's that sense of like, I need to take that person out so I can win when there are scarce resources and only the top can reach them.
I think it's that kind of competition or that kind of structure that is toxic in any classroom, let alone in any sort of work environment. So, and I think there's really good work now in the measurement of collaboration that is very promising at its early stages. And some of my colleagues, I was recently, I just termed off the board of the Carnegie Foundation for the Advancement of Teaching and the Carnegie Foundation is doing some very interesting work on the measurement of these new skills, which include skills like collaboration. So I'm loving seeing this. think there is a lot of, it's very expensive to measure collaboration and it can be very context dependent, but this is some really great leading edge work. As always, if you end up with a collaboration score, as I'll say, it's like treat it lightly.
Andrew
Again, don't make it more meaningful, more precise, and more permanent and add it to this list of things that are important to measure. Don't make it the be all, end all, one true outcome kind of mindset that we often have when it comes to education. Just pick that one thing and orient to that and that will be your silver bullet. As you know, there's a long history in education of silver bullet solutions.
Susan
Yeah, and I think we're still seeing a lot of that still trying to make its mark. And I know that a lot of your research focuses on educational inequality. So how can we use data to shed light on gaps that we might miss if we are just focused on those test scores or that silver bullet that's promised us?
Andrew
I mean, this is a challenge. So again, a gap like any other number can be overemphasized. some of my colleagues, like for example, David Quinn has been doing some really good work by saying, even if you say achievement gap, people will have a way of making it permanent and inevitable in their heads, right? Like not something we should close or that reflects a source of unequal opportunity.
It's inevitable and therefore, you know, we should stratify society accordingly. So even the idea of an achievement gap has its own comes with its own like burdens related to quantification, which we were talking about earlier. But what I hope my work and my colleagues work like Sean Reardon and Aaron Shaley and Ben Shere, we've been working on this project for well over a decade now called the Educational Opportunity Project. And I mentioned it in that talk that you had described earlier.
You can find it at edopportunity.org, like educational opportunity. So edopportunity.org. And it shows where districts and schools across the country stand in terms of educational opportunity on average. And actually what we think even more important, how they've changed over time, how much learning has happened over time. And that's what we hope gives people a sense of agency and competence and like, there are others, schools and districts that have made substantial progress. How can we do that? And we also, again, as you, as you know, it focused on opportunity gaps, disparities in opportunity and how we close them. Of course with, with test scores, you know, by then it's too late, right? And so a lot of the, a lot of the focus on educational opportunity and inequality and opportunity is now focused on what we call inputs instead of outputs.
The test scores, it's like, hey, that's the end of the year. What about all the stuff? What about the context? What about what we started with? And there's a great report that put, again, multiple measures. How do we put test scores alongside the context of what goes on in a school, in a district, including things like who the teachers are and what kind of background they have and education and qualifications they have including things like curriculum, like what is it that kids are learning and that teachers are assigning and how high quality, how much evidence is there around the curriculum, things like attendance, which also offers a kind of like, how much time were they actually in school, and issues like sort of segregation and out of school opportunities. One of the statistics I always try to remind people is
What percent of waking hours do kids spend in school? And the answer is like 20%. It's like far more time is spent out of school than in school in a school year, you count weekends and summers and how much time is actually spent in school in a day. So measuring a little bit of that 80 % in addition to the 20 % of what happens in school is also really important to understand educational opportunity and inequality and opportunity.
So that's what our project does. And again, we hope it offers context to the numbers, the qualitative as well as the quantitative.
Susan
Yeah, I think that's so important, especially in a big proponent of context in everything because it allows us to see a bigger picture or maybe a picture that was hidden to us before and it's sitting there right in plain sight. Before we go, I would love to get your last minute take on the idea of creativity and numbers and data. Lots of times they're pitted against each other. I know in the research for my upcoming book, I actually polled thousands of educators, I think maybe 40,000, who talked about, when I asked the question, what do you think impedes creativity? And the highest percentage, it's like 90%, said test scores. It's testing the era of testing, that is what impedes creativity. But when you actually dig into the research, what I have found is that it is actually opportunity. It's the thing that impedes creativity the most is lack of opportunity and oftentimes socioeconomic opportunities specifically. So I'm curious on your take before you leave, just like a hot take on the connection between creativity and data and how we might be able to fuse them to have a more meaningful educational experience there.
Andrew
Yeah, so thank you for the question. I love numbers, right? And I, in many ways, love thinking about test scores because, as I said, they have to be qualitative before they're quantitative. And then once they're quantitative, as I said, you have to make them qualitative again. have to explain them to somebody. And I think there's an incredible amount of creativity that comes into the qualitative before the quantitative, and also the act of making the quantitative qualitative again, which is to say, what does a 300 mean? What does a 76 mean? What do any of these numbers mean? So when I teach, so again, for the math teachers and the science teachers and all the teachers who use numbers, which is all teachers at some point, I encourage you to teach creatively about numbers potentially including test scores. And when I teach, I have what my students and I like to call the five Gs. So whenever I teach statistics and psychometrics and all these quantitative subjects that we need to create better test scores and the qualitative and the quantitative sense, I have what I call the five Gs. So the five Gs are first Greek graphs and grammar. So Greek, I mean by like, you know, those equations, right? And statistics that are all in these Greek letters.
So you have to at some point have like an equation. has to be, and when I teach at some point there will in fact be an equation. And that makes a lot of people feel a certain way, usually kind of negative and intimidated. And what I try to do is remind them that they have power over that, right? That they can write the Greek and understand what it means. The graphs, right? So most, almost all of those equations can be visualized in a figure, right? And so when anyone, you know, usually in math and science teaches, they often, in addition to writing equations, graph that out and show it visually in some compelling way. And then grammar, which is to say, write it in a sentence. If I give you a number, then write it. You have to say what that means, which is, again, making the quantitative, qualitative. So those are three Gs, Greek, graphs, and grammar. What I also try to do, and this gets to the creativity and maybe the arts, is I try to do gadgets and games. So every class, actually every week, I try to have a game that I play that encourages people to… This is my point about competition earlier. It doesn't necessarily have to… You can have collaborative games, can have games that are lighthearted and fun. I play games like Guess the Correlation, which a correlation is a measure of how two variables are related, like socioeconomic status and opportunities for creativity. Those are correlated, right? So I play Guess the Correlation, and we have these friendly competitions and people win prizes.
And then I have gadgets, and this is what we were talking about in the time before we started. I actually have around my office, this is my sabbatical office right now, so I don't have much in there, but I have a lot of gadgets that I use to illustrate concepts. So, and they have to be 3D real and tangible. You have to be able to feel them. I know this is primarily an audio podcast, but I have, for example, right here, this is a picture of a normal distribution, which is a concept in statistics. And it's a, it's a stuffed, it's a plushie, right? So for those who can see it on YouTube, you'll see it's got a little smiley face right there. And I actually have a whole bunch of them. Here are littler ones. And my students actually sometimes take these creative projects on as assignments, right? So a student of mine actually created these in a fab lab that we have here, a fabrication lab that we have here. And so all of statistics teachers who are listening to you. If you want any normal distributions, feel free to hit me up. But I guess that's what I'd say too, is all teachers have an opportunity to make numbers meaningful, make numbers memorable. And I hope we take that challenge, right? Is to not have test scores continue to feel oppressive. But instead of ignoring them, which we can do and probably should do more, we should also empower ourselves to make numbers meaningful and to give that sense that again back to agency, competence and social integration, that we're working together to increase our learning, which also happens to increase some numbers. And that should give us a sense of empowerment, not a sense of paralysis and hopelessness.
Susan
I love that. Well, Andrew, can you let us know where we can stay in touch with you and all the work you're doing?
Andrew
Sure. You can find me on Blue Sky. You can look me up on Blue Sky if you like on the social media platform or LinkedIn. You can Google me at Andrew Harvard. And also I am recently the, I'm now the past president of the National Council on Measurement in Education, NCME, National Council on Measurement in Education. Actually every other year we have a classroom assessment conference where you do have some psychometricians, but you also have experts in classroom assessment.
And we gather in a nice place every other year so any of your teachers who want to learn more about assessment and measurement and interact with folks like me, I welcome you to join NCME and our Classroom Assessment Conference.
Susan
Love that. will put all of that in the show notes. Andrew, thank you so much for your time today. I learned so much from you. And I'm so glad that you're helping us to take the fear out of numbers and make them more meaningful throughout. So thank you again.
Andrew
Thanks for the great questions.
Andrew Ho on BlueSky
National Council on Measurement in Education (NCME)
NCME's Classroom Assessment Conference
Andrew's YouTube Video

